FAQ #
Each assignment will have an FAQ linked at the top. You can also access it by adding “/faq” to the end of the URL. The FAQ for Lab 02 is located here.
Introduction #
To debug a program, you must first know what’s wrong. In this lab, you’ll get some experience with using the debugger to see program state. When you run into a bug, the error is accompanied with a “stack trace” that details the method calls that caused the error in the first place. One of the focuses of this lab will be to get you used to reading these stack traces, because they can be super helpful in debugging your own code.
Setup #
Follow the assignment workflow instructions to get the assignment and open it in IntelliJ.
Goals and Outcomes #
In this lab, you will enhance your code debugging abilities by defusing a (programmatic) bomb and debugging a text adventure we have written. We’ll guide you through this process, but the intention is to make this a realistic debugging experience.
By the end of this lab, you will…
- Be able to use the debugger and visualizer to inspect program state.
- Be able to interpret test failure messages.
- Be able to interpret stack traces.
- Be better able to approach debugging code.
- Have learned about some common Java bugs and errors.
IntList Aside #
Added to our implementation in Wednesday’s lecture are two methods in the
IntList class, print and of. The of method is a convenience method for
creating IntLists. Here’s a quick demonstration of how it works. Consider the
following code that you’ve seen in lecture for creating an IntList containing
the elements 1, 2, and 3.
IntList lst = new IntList(1, new IntList(2, new IntList(3, null)));
That’s a lot of typing, and is quite confusing! The IntList.of method
addresses this problem. To create an IntList containing the elements 1, 2, and
3, you can simply type:
IntList lst = IntList.of(1, 2, 3);
The other method print returns a String representation of an IntList.
IntList lst = IntList.of(1, 2, 3);
System.out.println(lst.print())

// Output: 1 -> 2 -> 3
These methods mostly provide convenient ways of creating and displaying
IntLists, respectively. We use these convenience methods to make testing
easier.
Bomb #
The BombMain class calls the various phase methods of the Bomb class.
Your job is to figure out what the passwords to each of these phrases is by
using the IntelliJ debugger.
The code is written so that you can’t find the password just by reading it. For
this lab, you are forbidden from editing the Bomb code, whether to add
print statements or otherwise modify it.
The point of this exercise is to get comfortable using tools that will help you a lot down the road. Please take it seriously!
Interactive Debugging #
So far, you might have practiced debugging by using using print statements to see the values of certain variables as a program runs. When placed strategically, the output from printing might help make the bugs obvious or narrow down their cause. This method is called print debugging. While print debugging can be very useful, it has a few disadvantages:
- It requires you to modify your code, and clean it up after.
- It’s tedious to decide and write out exactly what you want to print.
- Printing isn’t always formatted nicely.
In this lab, we’ll show you a new technique, interactive debugging – debugging by using an interactive tool, or a debugger. We’ll focus on IntelliJ’s built-in debugger.
Debugger Overview #
Breakpoints #
Before starting the IntelliJ debugger, you should set a few breakpoints. Breakpoints mark places in your code where you can suspend the program while debugging and examine its state. This:
- Doesn’t require you to modify your code or clean it up after, since breakpoints are ignored in normal execution.
- Lets you see all the variables without needing to write print statements.
- Lets IntelliJ display everything in a structured manner
To set a breakpoint, click the area just to the right of the line number.
A red circle or diamond should appear where you clicked. If nothing appears, make sure that you click next to a line with code. When the debugger reaches this point in the program, it will pause before the execution of the line or method. Click the breakpoint again to remove it.
Running the Debugger #
Once you’ve set some breakpoints, you’re ready to start a debugging session!
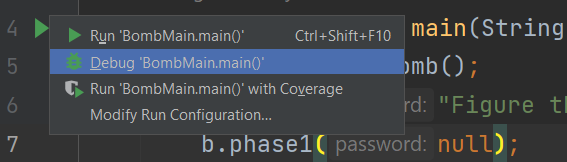
Click on the green triangle next to the class or test you want to debug (in test
files there may be two green triangles). Instead of clicking the green triangle
to run, click the
 debug option:
The selected program should run until it hits its first breakpoint. A debugger window should also appear on the bottom of the interface, where the console was.
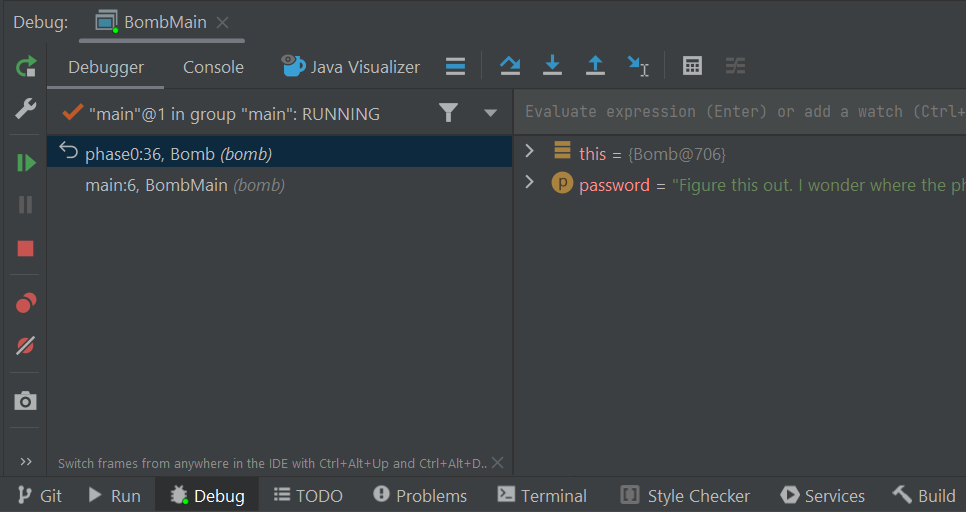
On the left, you will be able to see all current method calls and on the right, you will be able to see the values of instantiated variables at this point in the program (they will also be shown in gray text in the editor). For instances of classes, you can click the dropdown to expand them and look at their fields.
In the debugger, you have a few options:
- Learn something from the displayed values, identify what’s wrong, and fix
your bug! Click
 to stop the debug session.
 - Click
 to resume the program (until it
hits another breakpoint or terminates).
to resume the program (until it
hits another breakpoint or terminates). - Click
 to advance the program by
one line of code.
to advance the program by
one line of code.
 does something similar, but
it will step into any method called in the current line, while
will step over it.
does something similar, but
it will step into any method called in the current line, while
will step over it. will advance the program until
after it returns from the current method.
will advance the program until
after it returns from the current method.
- If you accidentally step too far and want to start the session over, click
 .
.
To see the console output (and type into the console) while debugging, click the “Console” tab next to “Debugger” in the top left of the debug window, just above the frames. If you want to see everything simultaneously (while being more compressed), you can drag the console tab to the far right of the bottom panel. Here’s a GIF from a previous semester that shows this (IntelliJ looks different, but the action is the same.)
Bomb Introduction (Phase 0) #
For this lab, we will be providing hints. Please only use them if you’re stuck! You’ll get much more out of the exercises if you try to solve them on your own first.
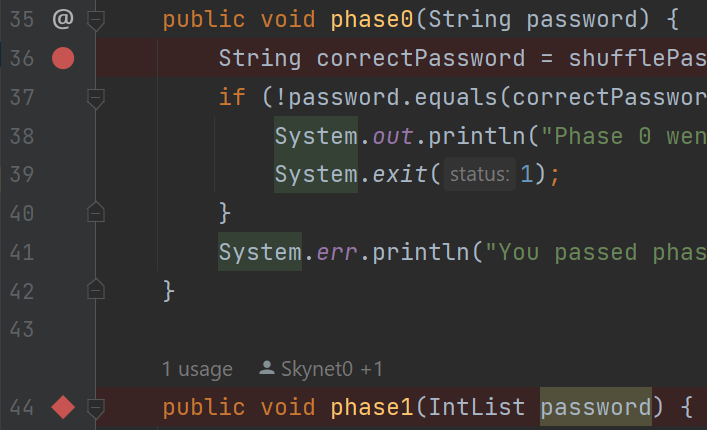
Task: Set a breakpoint at phase0 and use the debugger to find the password
for phase0 and replace the phase0 argument accordingly in
bomb/BombMain.java.
Once you’ve found the correct password, running the code (not in debug mode) should output “You passed phase 0 with the password <password>!” instead of “Phase 0 went BOOM!”
phase0 Method Breakdown
phase0 Method BreakdownThe phase0 method first generates a secret String correctPassword (you don’t
need to understand how shufflePassword works). The password passed in from
BombMain is then compared against correctPassword. The goal of this phase is
to use the debugger to find the value of correctPassword and pass in a
password that matches that value!
Visualizer (Phase 1) #
While being able to see variable values is great, sometimes we have data that’s
not the easiest to inspect. For example, to look at long IntLists, we need to
click a lot of dropdowns. The Java Visualizer shows a box-and-pointer diagram of
the variables in your program, which is much better suited for IntLists. To
use the visualizer, run the debugger until you stop at a breakpoint, then click
the “Java Visualizer” tab.
The password for phase 1 is an IntList, not a String. You may find the
IntList.of method helpful.
Task: Set a breakpoint at phase1 and use the Java Visualizer
to find the password for phase1 and replace the phase1 argument accordingly
in bomb/BombMain.java.
phase1 Method Breakdown
phase1 Method BreakdownThe phase1 method generates a secret IntList called correctIntListPassword
(similar to the previous phase, you don’t need to understand how
shufflePasswordIntList works). The password (in the form of an IntList)
passed in from BombMain is then compared against the correctIntListPassword
for equality. The goal of this phase is to use the debugger’s Java Visualizer to
find the structure and value of the correctIntListPassword’s IntList and pass
in a password that matches it!
Conditional Breakpoints (Phase 2) #
Sometimes you may want to have your program pause only on certain conditions. To do so, create a breakpoint at the line of interest and open the “Edit breakpoint” menu by right-clicking the breakpoint icon itself. There, you can enter a boolean condition such that the program will only pause at this breakpoint if the condition is true.
Another thing you can do is to set breakpoints for exceptions in Java. If your
program is crashing, you can have the debugger pause where the exception is
thrown and display the state of your program. To do so, click
 in the debugger window and press the plus icon to create a “Java Exception
Breakpoint”. In the window that should appear, enter the name of the exception
that your program is throwing.
in the debugger window and press the plus icon to create a “Java Exception
Breakpoint”. In the window that should appear, enter the name of the exception
that your program is throwing.
Task: Set a breakpoint at phase2 and use the debugger to find the password
for phase2 and replace the phase2 argument accordingly in
bomb/BombMain.java. Remember, don’t edit Bomb.java!
Note: The password isn’t given explicitly like in the previous phases.
Rather, your task is to construct an input so that the boolean correct
variable is set to true after phase2 is run.
Hint 1
You may want to look up Java’s split method for Strings if you’re unsure
of what it does.
Hint 2
You don’t necessarily need to construct the password in one line of code.
Hint 3
You’ll need to build the password in pieces so that the split method will cause
the correct number be in the right spot.
Hint 4
After you’ve constructed a sufficiently long String so that 1337 is a valid
index, set a conditional breakpoint inside the for loop that pauses the program
when i is close to 1337. Then step until you find the password.
phase2 Method Breakdown
phase2 Method BreakdownThe phase2 method takes in your password from BombMain and splits it by
spaces into the passwordPieces array. For example, if your password is "1 2
3", then passwordPieces will be equivalent to {"1", "2", "3"}.
The method then adds 100,000 random integers to a Set called numbers. It
then loops through them using a for-each loop, incrementing a variable i as it
goes along. On the 1338th iteration (because Java is zero-indexed, i == 1337
on iteration 1338), we check whether the integer at the 1337th index of the
passwordPieces array is equal to the current number.
At this point, you should be able to run the tests in tests/bomb/BombTest.java
and have all of them pass with a green checkmark.
Adventure #
Running the Game and Tests #
The very first thing you should do is run the main method in AdventureGame
to run through the game. This will give you a sense of what the program you are
debugging is actually supposed to do. Then, after you’ve run the game, run the
tests in tests/adventure/AdventureGameTests. They should fail on
BeeCountingStage which will lead you into debugging the first error below.
Reading Stack Traces #
When a runtime error occurs in Java, a stack trace is printed to the console
to provide information on where the error occurred and what steps the program
took to get there. When running Adventure for the first time, your stack
trace will look something like this:
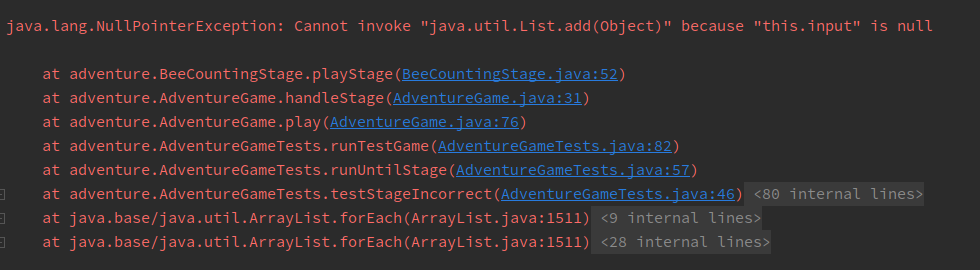
The first thing to note is what kind of error occurred; this is shown at the
first line of the stack trace. In this case, our code threw a
NullPointerException.
For some exceptions, including NullPointerExceptions, Java will give you an
explanation. Here, this.input is null, so we can’t invoke (call) a method on
it.
The lines beneath it represent the sequence of methods the program took to arrive at the error: the first line in the list is where the error occurred and the line beneath it represents the line of code that called the method which threw the error, and so on.
You can click on blue text to navigate to that file and line.
For each of the following stages, only change what is necessary! You should not be rewriting entire blocks of code unless otherwise specified. We’ve included how many lines we changed as a guideline.
Note: You can run through the adventure game each time if you’d like to
validate correctness, but you don’t need to - feel free to debug through the
tests directly. This can be done by setting a breakpoint in playStage for the
appropriate stage file you’d like to debug, then debugging AdventureGameTests.
Debug BeeCountingStage #
Task: Fix the NullPointerException that occurs in BeeCountingStage by
analyzing the stack trace. You can ignore the lines with <XX internal calls>;
these are from test framework or library code and usually won’t help you find
errors.
Expected lines modified: 1
It turns out that this isn’t the only error in BeeCountingStage!
Task: Fix the IndexOutOfBoundsError that occurs in BeeCountingStage.
Note: Ignore the grey links to Objects.java and ArrayList.java at the
top of the stack trace. The error may have occurred in code that was not
yours, but the root cause was probably something your code tried to do.
Expected lines modified: 1
Hint 1
Just because the error occurs on a certain line doesn’t necessarily mean that piece of code is incorrect - something not shown in the stack trace may be the elusive culprit!
Hint 2
Take a close look at the constructor.
Optional for This Week Only #
Note: Due to the Project 0 deadline and the length of this lab, the following tasks are optional for this week only. We still recommend you complete them for more practice debugging before finishing Project 0, but they will each be worth 0 points for Lab 02. They will be required and worth points for Lab 03.
Debug SpeciesListStage #
Task: Fix the error(s) in SpeciesListStage. If you don’t see what the
issue is inside the method where the exception occurred (the top line of the
stack trace), it’s often a good idea to look at the second line to see where the
method is being called from, and with what arguments.
Expected lines modified: 3-4
Hint
Consider the possibilities for lists. Does the code account for all of them? Are there any edge cases the code fails to handle?
Debug PalindromeStage #
Task: Sometimes, IntelliJ will tell you something that it thinks is wrong.
Hover over the yellow / orange highlights in the method with the bug. Does that
give you any useful information?
Use this feature to address the
error(s) in PalindromeStage.
Note: If the debugger feels unresponsive, it is usually due to an infinite loop somewhere in your code. If you set a breakpoint and it is never reached, then you know an infinite loop occurs before the breakpoint! Use this in combination with stepping to isolate the problem.
Expected lines modified: 3
Debug MachineStage #
The sumOfElementwiseMax method in MachineStage is supposed to take two
arrays, compute the element-wise max of those two arrays, and then sum the
resulting maxes. For example, for two arrays {2, 0, 10, 14} and
{-5, 5, 20, 30}, the element-wise max is {2, 5, 20, 30}. In the second
position, the larger of 0 and 5 is 5. The sum of this element-wise max is
$2 + 5 + 20 + 30 = 57$.
There are two different bugs that make the method return an incorrect result.
You can assume the input parsing code in playStage works correctly.
To find the bugs, you should not step into the mysteryMax or mysteryAdd
functions, or even try to understand what they are doing. That is, you should
use to only see the result. These
are mysterious functions that are deliberately obfuscated. If you find
yourself having accidentally stepped into one of these two functions, use the
button to escape.
Even without stepping INTO these functions, you should be able to tell whether they have a bug or not. That’s the glory of abstraction! Even if I don’t know how a fish works at a molecular level, there are some cases where I can clearly tell that a fish is dead.
Task: Fix the two bugs so that sumOfElementwiseMax returns a correct
result.
If you find a bug in mysteryMax or mysteryAdd, rewrite the method entirely
instead of trying to fix it. Don’t rewrite code unnecessarily, though – be
sure that it’s broken first!
Expected lines modified: 2-5
Hints
- Understand what the
sumOfElementwiseMaxfunction is supposed to do. When you give inputs to the game, try computing the answer by hand or with a calculator. Verify your computation against the output, and you’ll see that the output is incorrect. - Set a breakpoint on the line that calls
sumOfElementwiseMax. When you run the debugger, step intosumOfElementwiseMax, then use to see the result of the call
to arrayMax. Is the output ofarrayMaxwhat you expect it to be? - You should step into
arrayMaxif you think that there’s a bug there. Don’t step intomysteryMax, though – if and only if you think it has a bug, rewrite it completely. - Repeat for
arraySumandmysteryAdd.
Still Broken…? #
At this point, the test for correct inputs should pass. That test is testing a
correct input to the adventure game. The second test checks an incorrect
input (meaning one that gets something wrong at some point during the game). You
should have gotten an error this time which tells you that the output the game
gave did not match the output we expected. Click on <Click to see difference>,
and IntelliJ will tell you where and how the long String outputs differed.
Specifically, in this case, SpeciesListStage has a bug.
Task: Go back to SpeciesListStage to find and fix the bug (if you didn’t
find it before). You may find what you learned in PalindromeStage helpful.
Expected lines changed: 0-1
After completing this task, all of the tests should pass.
Hint
You can force Java to use decimal division by multiplying the numerator by
1.0.
Deliverables and Scoring #
The lab is out of 256 points. There are no hidden tests on Gradescope. If you pass all the local tests, you will receive full credit on the lab.
- Find all the passwords in
BombMain.java. (3 parts, 64 pts each) - Fix the bugs in
BeeCountingStagefor correct inputs. (1 part, 64 pts) - (Optional, but required for Lab 03) Fix all bugs in the remaining adventure game stages for correct inputs. (3 parts, 0 pts each)
- (Optional, but required for Lab 03) Fix the bug in the adventure game for incorrect inputs. (1 part, 0 pts)
Submission #
Just as you did in Lab 1, add, commit, then push your Lab 2 code to GitHub. Then, submit to Gradescope to test your code. If you need a refresher, check out the instructions in the Lab 1 spec and the Assignment Workflow Guide.
Acknowledgements #
This assignment is adapted from Adam Blank.